
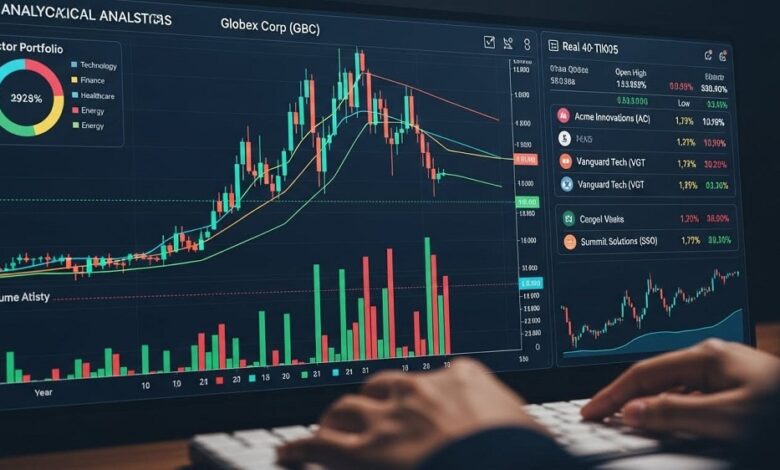
The global financial markets operate as vast, hyper-connected networks where billions of dollars change hands every second. In this fast-paced environment, the difference between a highly profitable trade and a catastrophic financial loss often comes down to a matter of milliseconds or a single miscalculated variable. Historically, floor traders relied heavily on intuition, market rumors, and basic chart reading to execute their positions.
In the modern trading landscape, relying on gut feeling is a recipe for financial ruin. The democratization of computing power, the rise of algorithmic high-frequency trading, and the explosion of digital information have transformed trading into a deeply scientific discipline. To survive and thrive, modern traders must act as data scientists. Implementing data analysis allows market participants to strip emotion from their operations, identify hidden market inefficiencies, and make smarter, highly objective trading decisions.
Transitioning from Subjective Speculation to Quantitative Analysis
The primary challenge every trader faces is cognitive bias. Human beings are naturally vulnerable to psychological traps, including confirmation bias, where a trader looks only for news that supports their existing position, and loss aversion, which causes individuals to hold onto losing trades far too long in the vain hope of a market turnaround.
Data analysis serves as the ultimate psychological equalizer. By filtering market activity through mathematical models and statistical software, traders replace subjective opinions with quantifiable facts.
-
Objective Signal Generation: Data tools allow traders to establish rigid, rule-based entry and exit parameters. A trade is executed only when specific mathematical thresholds are met, completely removing human hesitation from the execution process.
-
Historical Statistical Validation: Before risking actual capital on a new market theory, data analysis enables traders to verify if their strategy would have been profitable in the past across different market cycles.
-
Granular Risk Management: Analytical software continuously calculates real-time risk parameters, ensuring that no single market anomaly can completely wipe out a trading account.
By grounding every market interaction in empirical evidence, quantitative traders insulate themselves from the emotional highs and lows that typically destroy retail portfolios.
The Triad of Modern Trading Data: Technical, Fundamental, and Alternative
To build a comprehensive market perspective, analytical traders utilize three distinct data pipelines. Integrating these separate information streams provides a holistic view of asset pricing, allowing traders to anticipate market movements with higher statistical probability.
Advanced Quantitative Technical Data
Technical analysis involves studying historical price actions, volume metrics, and order flow data to identify recurring market patterns. Modern technical analysis goes far beyond simple trend lines. Traders analyze mathematical data points, such as order book imbalances, volume profiles at specific price nodes, and statistical volatility deviations. By recognizing how liquidity moves within the electronic order book, traders can spot institutional accumulation patterns before a major price breakout occurs.
Automated Fundamental Data Processing
Fundamental analysis evaluates the underlying economic health of an asset. For stock traders, this includes analyzing corporate balance sheets, quarterly earnings reports, and price-to-earnings ratios. For foreign exchange or commodity traders, it involves monitoring global interest rates, inflation metrics, and employment data releases. Data analysis tools automate the scraping and parsing of these massive financial reports the instant they are published, allowing traders to adjust their allocations faster than humanly possible.
The Rise of Alternative Data Sets
In a highly competitive landscape, standard financial reports and price charts are widely available to everyone. To secure a distinct informational edge, institutional traders increasingly rely on alternative data sets. Alternative data includes non-traditional information streams, such as satellite imagery of retail parking lots to predict quarterly store revenue, cargo ship tracking data to forecast oil supply disruptions, and real-time social media sentiment parsing to gauge retail investor enthusiasm. Analyzing these unconventional data pipelines allows traders to uncover market trends well before they reflect in the standard price charts.
Algorithmic Execution and Strategy Backtesting
A core application of data analysis in modern trading is backtesting. Backtesting involves running a specific set of trading rules against historical market data to evaluate how the strategy would have performed over months or years. This process helps traders optimize their algorithms before risking a single dollar of live capital.
A rigorous backtesting protocol utilizes complex statistical metrics to evaluate the true viability of a trading system.
-
Maximum Drawdown Evaluation: This metric measures the largest peak-to-trough decline in account value during the testing period, helping traders understand the worst-case scenario they must be psychologically prepared to endure.
-
The Sharpe and Sortino Ratios: These mathematical formulas calculate the risk-adjusted return of a strategy, proving whether the net profits are a result of smart strategy execution or simply taking on excessive, dangerous levels of volatility.
-
Win-Loss Profit Factor: This ratio compares the total gross profits generated by winning trades against the total gross losses from losing positions, ensuring the average win size safely outpaces the average loss size.
Once a strategy is validated through backtesting, traders deploy algorithmic execution systems. These automated programs scan the markets continuously, executing trades instantly when parameters align, eliminating the delays associated with manual human order entry.
Predictive Analytics and Artificial Intelligence in Market Forecasting
The cutting edge of trading data analysis lies in predictive analytics, powered by artificial intelligence and machine learning algorithms. Traditional statistical models excel at analyzing linear relationships, but financial markets are chaotic, non-linear systems where past performance never perfectly mirrors future results.
Machine learning models, such as neural networks and random forest algorithms, excel at identifying subtle, multi-dimensional correlations across thousands of seemingly unrelated variables simultaneously. For instance, an AI system can analyze how changes in bond yields, corporate credit spreads, and regional weather patterns collectively impact the price movement of agricultural commodities.
Furthermore, predictive tools utilize natural language processing to execute sentiment analysis. These algorithms read millions of financial news articles, central bank speeches, and regulatory filings per second, converting unstructured text into a numerical sentiment score. If the software detects a subtle shift in tone from a central bank governor, it can automatically adjust the trader’s currency exposures ahead of the broader market reaction.
Risk Mitigation via Real-Time Analytics
While maximizing profit is the ultimate goal, preserving capital is the absolute prerequisite for trading longevity. Data analysis plays a vital role in modern risk mitigation, ensuring that a trading desk maintains total control over its exposures even during black swan market shocks.
Real-time analytics software continuously monitors portfolio risk parameters. It calculates value at risk metrics, which estimate the maximum potential loss the portfolio could experience within a specific timeframe under normal market conditions. Additionally, risk systems execute automated stress testing simulations, modeling how the current trading positions would behave during historic financial crises, such as sudden market crashes or unexpected geopolitical conflicts. If the system detects that an aggregate exposure breaches predefined safety mandates, it can automatically scale back position sizes to shield the enterprise from financial disaster.
Frequently Asked Questions
What is the primary difference between data mining and genuine statistical edge in trading?
Data mining occurs when a trader tests thousands of random variable combinations against historical data until they find a strategy that looks highly profitable purely by coincidence. This leads to curve-fitting, where the strategy performs exceptionally well on past data but fails immediately in live markets. A genuine statistical edge rests on a clear economic rationale and holds up across diverse, unoptimized market conditions.
How much historical data is required to conduct a statistically valid backtest for an intraday strategy?
For intraday trading strategies, a valid backtest generally requires a minimum of three to five years of high-resolution tick or minute-by-minute data. This extensive timeframe ensures the trading model is exposed to various distinct market regimes, including sustained bull markets, violent bear markets, low-volatility consolidation periods, and high-volatility liquidity crises.
Why do algorithmic trading strategies that perform perfectly in simulation sometimes lose money in live execution?
This discrepancy is typically caused by execution slippage and transaction friction. Simulations often assume that orders are filled instantly at the exact displayed price for zero cost. In live environments, market impact, exchange fees, order routing delays, and lack of available liquidity mean traders often buy at slightly higher prices and sell at slightly lower prices, eroding the simulated profit margins.
How does sentiment analysis software quantify unstructured text data from social media platforms?
Sentiment analysis systems utilize natural language processing algorithms trained on vast financial vocabularies. The software scans text data for specific keywords, phrases, and contextual modifiers, assigning a mathematical score ranging from highly negative to highly positive. These individual metrics are then aggregated into a single sentiment index that traders use to measure crowd behavior.
What is the role of machine learning in dynamic position sizing for portfolio management?
Rather than utilizing a rigid, fixed dollar amount for every trade, machine learning algorithms analyze real-time market volatility, current strategy win rates, and cross-asset correlations to adjust position sizes dynamically. When market conditions match environments where the strategy historically achieved high success, the system increases position sizes, while scaling them down during periods of high market uncertainty.
How can retail traders access institutional-grade alternative data without a multi-million dollar budget?
While satellite data remains expensive, retail traders can access powerful alternative datasets through specialized consumer platforms and open-source APIs. Web-scraping tools allow individuals to monitor public developer activity on software repositories, track public blockchain transaction volumes, evaluate search engine keyword trend data, and analyze government regulatory registry changes at minimal cost.


